Hello, I once saw a Confluence page with diagrams, pie charts, generated from Jira issues. I could not edit that page and could not check how that is done. Can you help me?
You can use the Jira report blueprint to create a status report. This status report visually shows the progress in your projects using diagrams.
Click on the three dots next to “Create” in the menu.

Then select “Jira Report” and click “Next”.
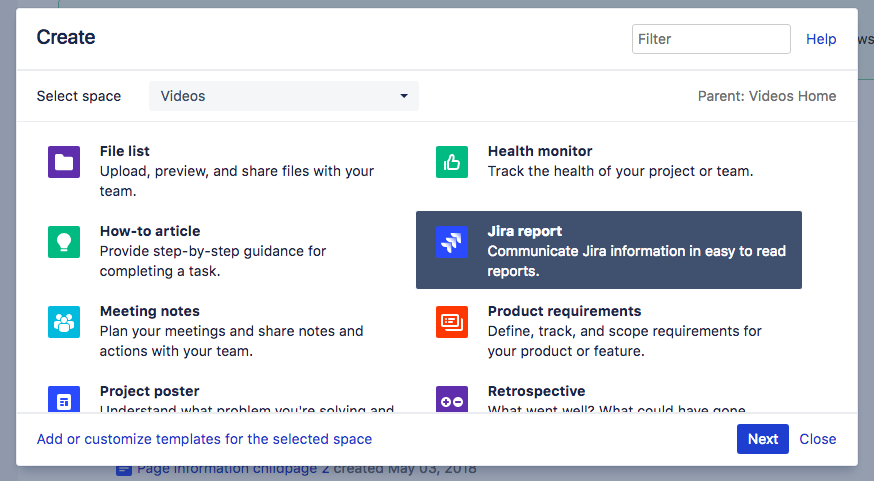
In the report type dialog, select “Status report” and click “Next” again.

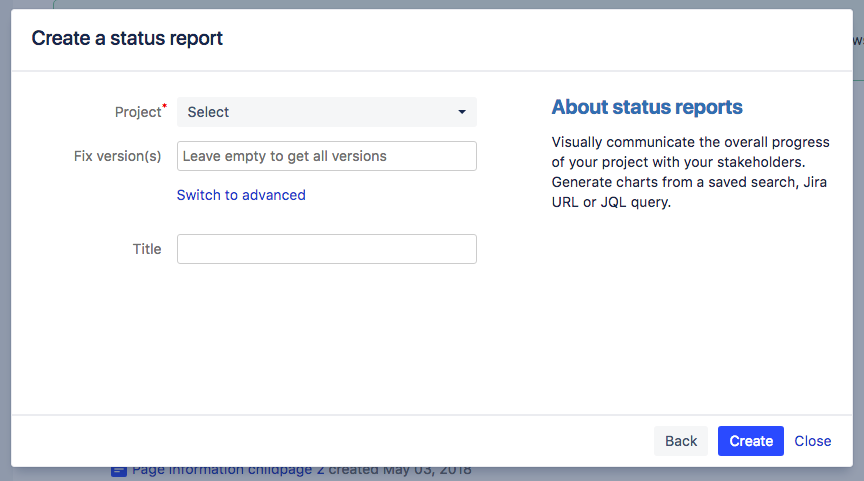
Select the project and enter Fix versions if you want to. You can also enter a page title. Then click on “Create”.
You will see a report page with sample text and pie charts, created using the JIRA diagrams macro. This macro is dynamic and will be updated on the Confluence page when issues are changed in Jira.
Please watch our Video #112 of the Video Tutorial Series “Learn Atlassian Confluence” and see this page of Atlassian’s original documentation for more info on this blueprint.
Please also see these answers about the dynamic change log and the static Jira report.

Here is a detailed summary of all the possible options for linking Jira data with reports and charts in Confluence.
Including how to customise Jira charts in Confluence.
1 Like