I saw that co-workers display search results in their dashboard. That looks very practical to me. How can that be done?
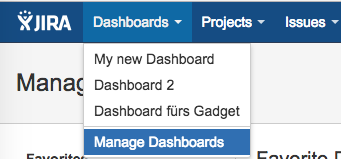
You can display the issues found by a search filter on a dashboard by adding a widget. Click on “Dashboards” in the menu, then on “Manage dashboards”.
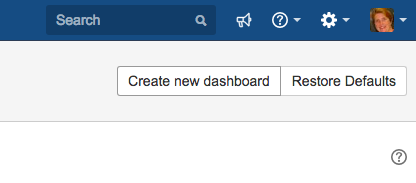
Click on “Create new dashboard”
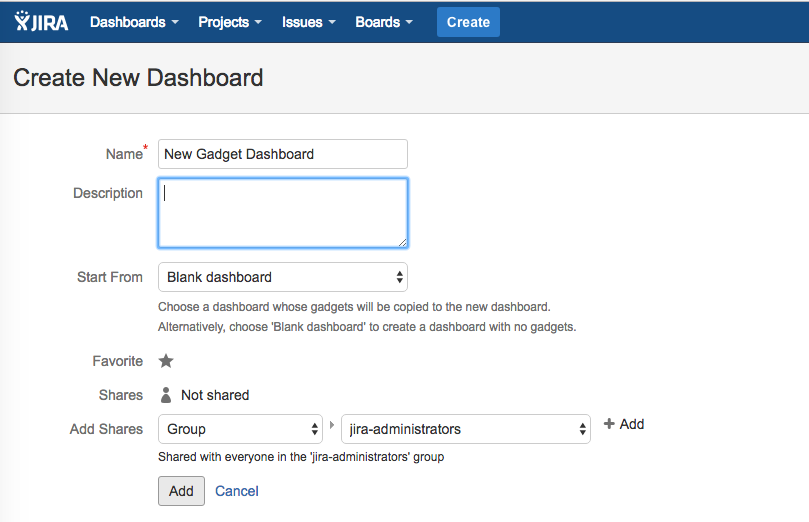
and enter a name for your dashboard. You can also add a description.
Select either an existing dashboard on which to base your new dashboard, or start from a “Blank dashboard”.
Here, you can set who can view your dashboard - select appropriate settings from the drop down lists and click on the plus symbol. When you’ve finished, click Add.
In the list of Favorite dashboards, click on your newly created dashboard.
Now, click on “Add a new gadget” to see the available dashboard gadgets. Type “Filter results” in the search field, then click on “Add gadget”.
Enter the name of your filter in the “Saved filters” field. Then enter the number of issues you want the gadget to display. You can change the order of the columns, or add more fields. You can also set how often you want the gadget to refresh. When you have finished, click on “Save”.

You will see this dashboard in the menu under “Dashboards”. Click on it to see the list of issues found by the search filter.
Please watch our Video #15 of the Video Tutorial Series “Learn Atlassian Jira” and see this page of Atlassian’s original documentation for more info.
