I see others in my company with a chart of search results on their dashboards. How can I do that? Do you know?
Yes, you can export the search results from the Issue navigator in a number of ways. One option is to display the filtered list as dashboard gadgets.
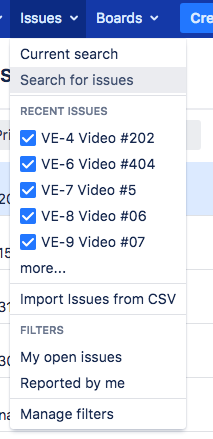
Click on “Issues” and then on “Search for Issues”. Enter your search query.
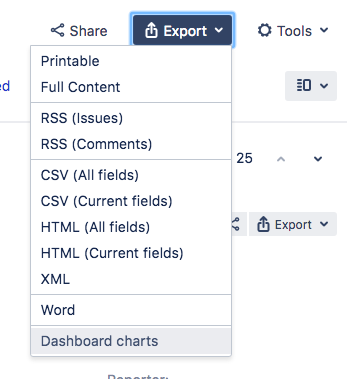
Then click on “Export”, and you will see various options. Click on “Dashboard charts”.
The search results are displayed as list of filtered results by default. You can select the gadget or diagram you want to display. There is a bar chart for “Average Age”, and a chart for “Created versus Resolved”. There are also charts for “Heatmap”, “Pie Chart”, “Recently Created”, “Resolution” and “Time Since”.
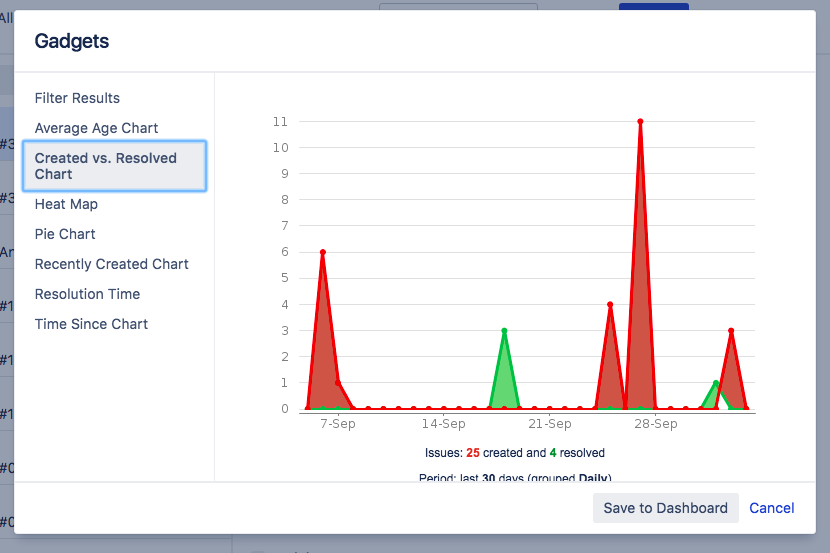
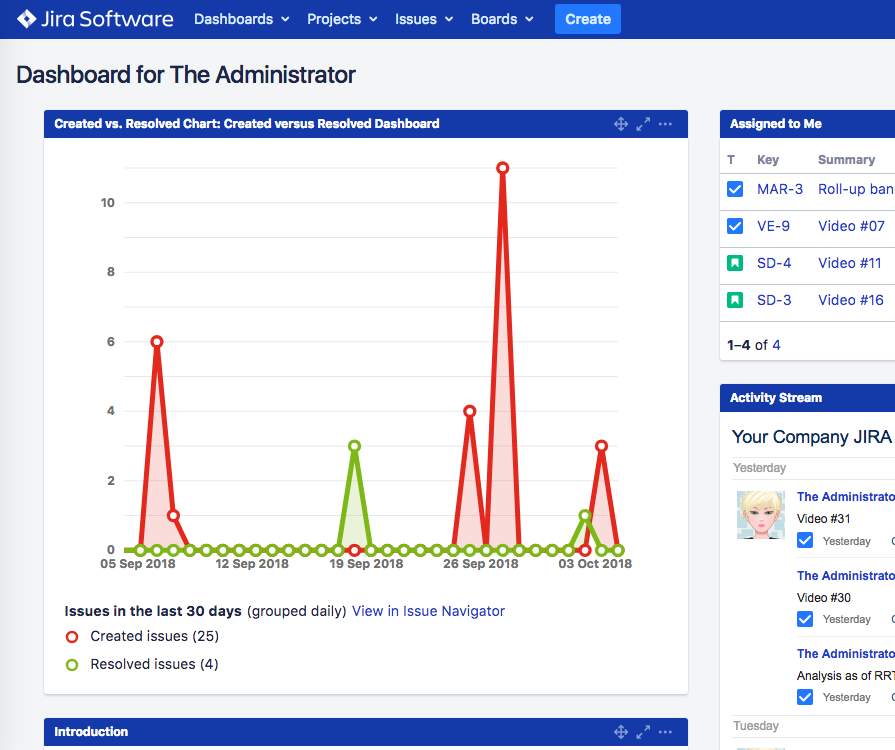
For example, the “Created versus Resolved” chart displays the created and completed issues during a specific time period.
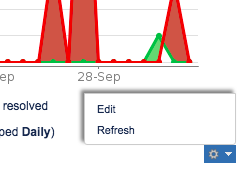
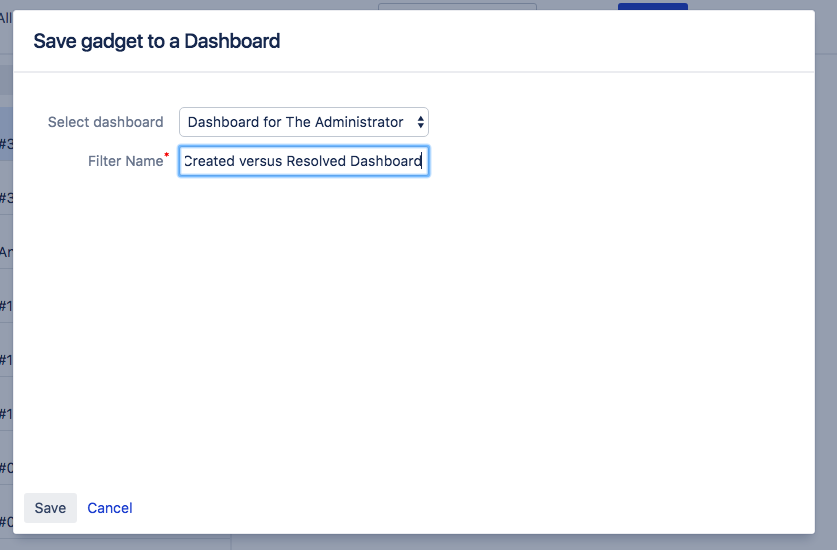
Click on the gear icon to refresh or edit the charts and change their criteria. To finish, click on “Save to Dashboard”.
Select the dashboard on which you want to display the chart, enter a filter name and click on “Save”.
You will see the gadget on the dashboard, and you can quickly return to the issue list by clicking on “View in Issue Navigator”.
This is Video #30 of our Video Tutorial Series "Learn Atlassian Jira". You can also read all about this subject in Atlassian’s original documentation.
